ESG, Smart Infrastructures Daniel Gelinas ESG, Smart Infrastructures Daniel Gelinas

4. The True Impact of Secure E-Bike Parking Over Time

One secure e-bike parking stall can replace up to 900 car trips per year. Here’s how infrastructure turns mobility goals into measurable results.

BIKE-OASIS Management Console

Learn why secure e-bike parking is a powerful tool for real estate developers to reduce car dependency, minimize grid impact, and deliver measurable ESG outcomes.

Daily Trip Displacement: How Many Car Trips Can One Stall Replace?

Drawing on Don Cicleto’s extensive European deployment data and early North American usage patterns, a single secure stall typically supports:

  • 1–3 displaced car trips per weekday

  • 2–6 displaced car trips on weekends in mixed-use and retail environments

  • Higher displacement rates on university campuses, where daily routines are predictable and parking constraints are strong

Using a conservative annual model, this translates to:

400–900 displaced car trips per stall, per year

When deployed at scale—40, 80, or 200 stalls—this creates a quantifiable mobility impact that can be directly integrated into:

  • GHG Protocol Scope-3 reporting

  • TCFD climate-risk disclosures

  • GRESB real-asset sustainability benchmarking

Unlike aspirational mobility targets, secure parking produces verifiable, repeatable outcomes.

Read More
Daniel Gelinas Daniel Gelinas

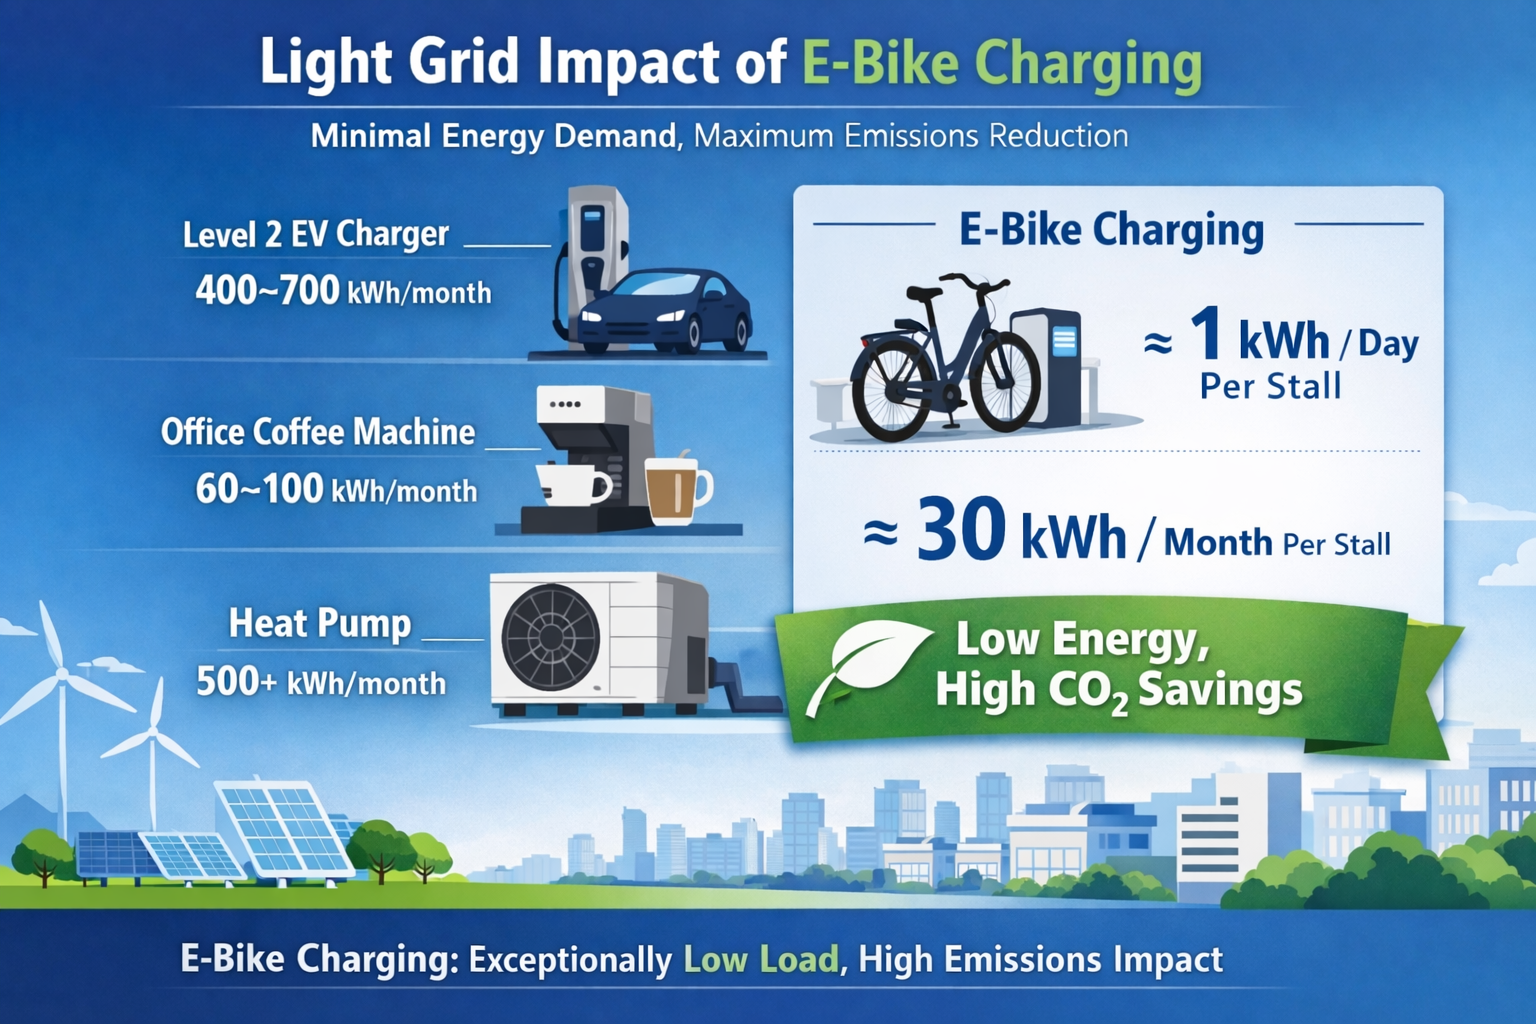
3. Grid Impacts: Modern E-Bike Charging Is Exceptionally Light

One of the most persistent misconceptions surrounding e-bike infrastructure is that charging represents a meaningful burden on building electrical systems or local grids. In reality, e-bike charging is one of the lowest-impact electrification loads available.

Light Grid Impact of eBike Charging

One of the most persistent misconceptions surrounding e-bike infrastructure is that charging represents a meaningful burden on building electrical systems or local grids. In reality, e-bike charging is one of the lowest-impact electrification loads available.

A typical e-bike battery operates within the following range:

  • Capacity: 400–700 Wh

  • Charging power: 70–150 W

  • Electricity per full charge: ~0.5 kWh

Even under a conservative scenario—two full charges per stall per day—the total demand remains minimal:

  • ~1 kWh per day per stall

  • ~30 kWh per month per stall

Putting this into perspective

To contextualize this load:

  • A Level 2 EV charger typically consumes 360–720 kWh/month

  • An office coffee machine consumes 60–100 kWh/month

  • A heat pump can exceed 500 kWh/month, depending on climate and usage

Against these benchmarks, e-bike charging is almost negligible—yet the emissions avoided per kilowatt-hour consumed are disproportionately high.

This combination of very low energy demand and very high emissions displacement explains why secure, controlled e-bike charging is increasingly integrated into decarbonization, ESG, and energy-transition strategies across real estate portfolios and campuses.

Read More
Daniel Gelinas Daniel Gelinas

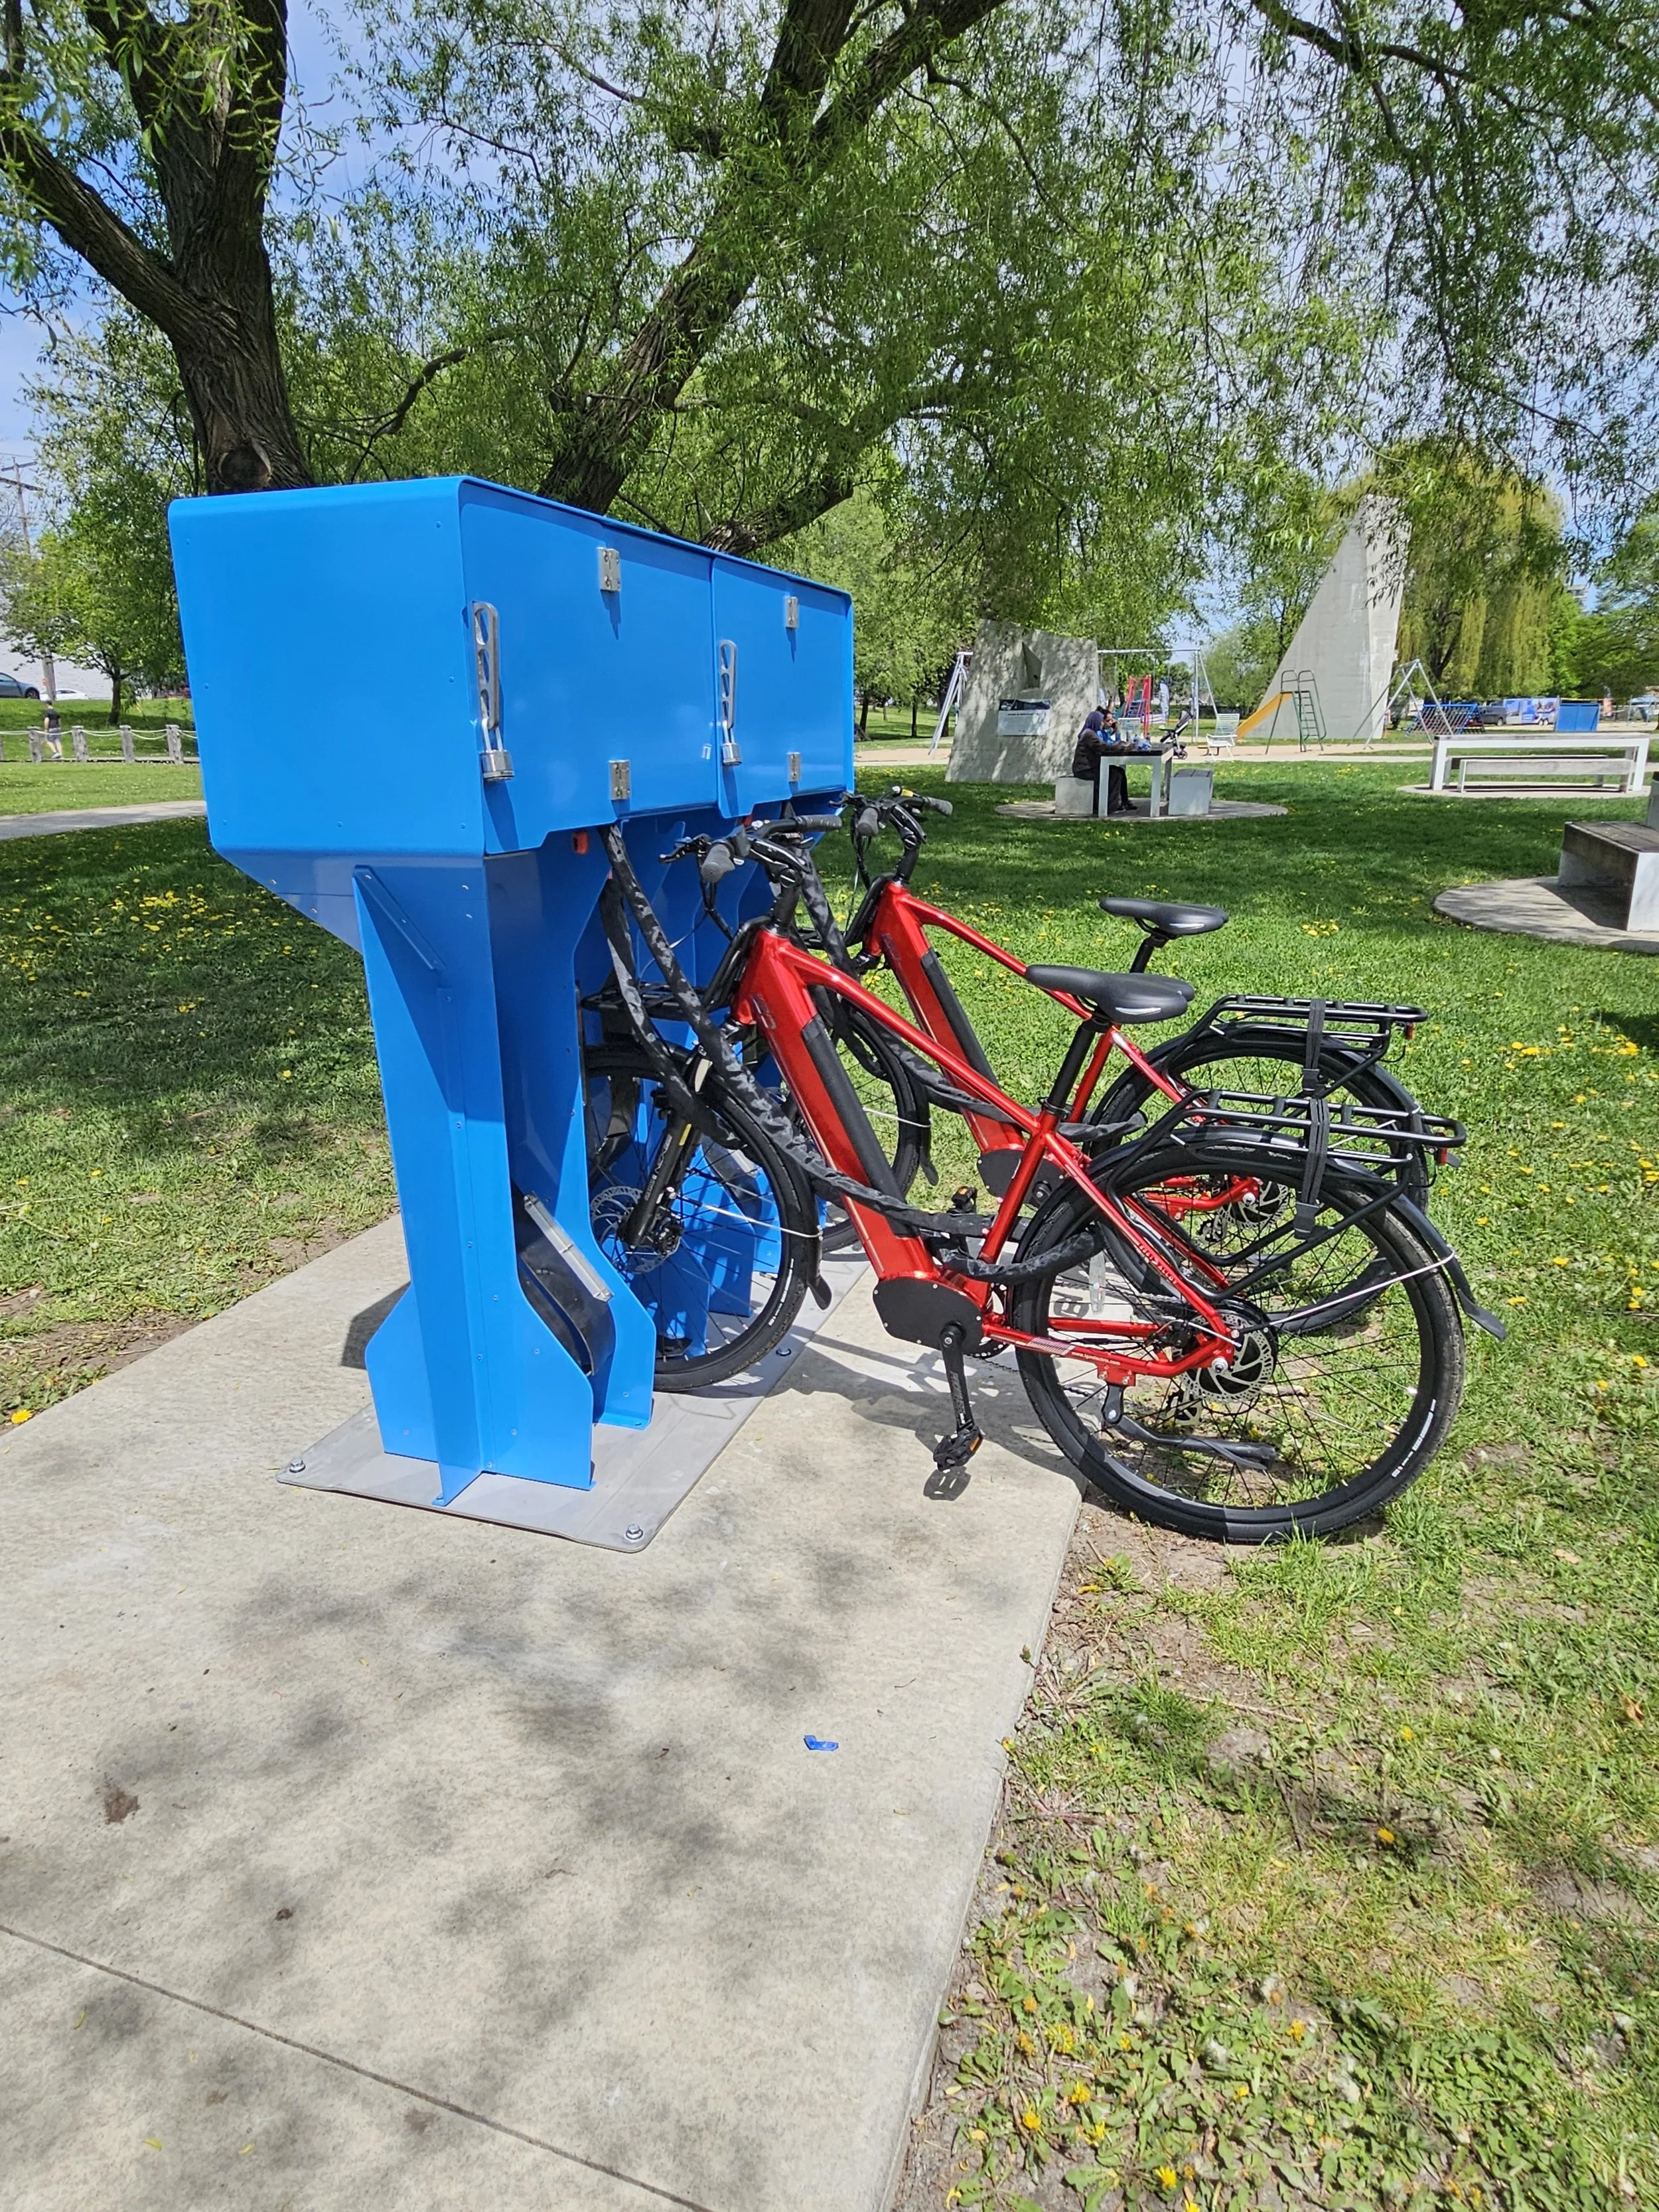
2. Why Secure Parking Is the Trigger for Mode Shift, Not Bike Lanes Alone

Secure End-of-Trip Infrastructure: The Real Catalyst Behind Mode Shift

For more than a decade, urban mobility strategies in North America have focused heavily on in-route infrastructure—bike lanes, shared paths, and protected intersections. While these investments are necessary, experience from European deployments and early North American pilots shows they are not sufficient to trigger sustained mode shift on their own.

The decisive factor is not what happens between origin and destination, but what happens at the destination.

Surveys and usage data consistently show that the decision to commute by bike or e-bike hinges on a simple question:
“Will my bike—and its battery—still be there, safe and usable, when I come back?”

The real barriers holding riders back

Across cities, campuses, and employment centres, e-bike users cite a remarkably consistent set of barriers:

  • Theft, by far the number-one deterrent, even in cities with good cycling infrastructure

  • Battery theft, which can render an e-bike unusable in seconds

  • Fire-safety concerns, particularly when charging indoors or near occupied spaces

  • Weather exposure, which discourages year-round use

  • Lack of keyless access, forcing users to manage locks, keys, and cables

  • No personal storage for helmets, chargers, rain gear, or accessories

These barriers are psychological as much as practical. If even one remains unresolved, many users revert to driving—especially for work, school, or errands that require reliability.

Why secure parking changes behaviour

The Velovoute platform was designed specifically to remove these friction points at once:

  • Fire-contained, controlled charging eliminates improvised charging in common areas

  • Secure, private vaults remove bikes from shared, crowded rooms

  • Keyless smart access via Bike Oasis eliminates keys, codes, and lock anxiety

  • Personal storage supports daily commuting needs, not just parking

  • Weather protection enables true four-season usability

  • Usage analytics provide visibility and accountability for operators and ESG teams

When end-of-trip uncertainty disappears, behaviour changes.
Trips shift not because people love infrastructure—but because they trust the system.

Read More