
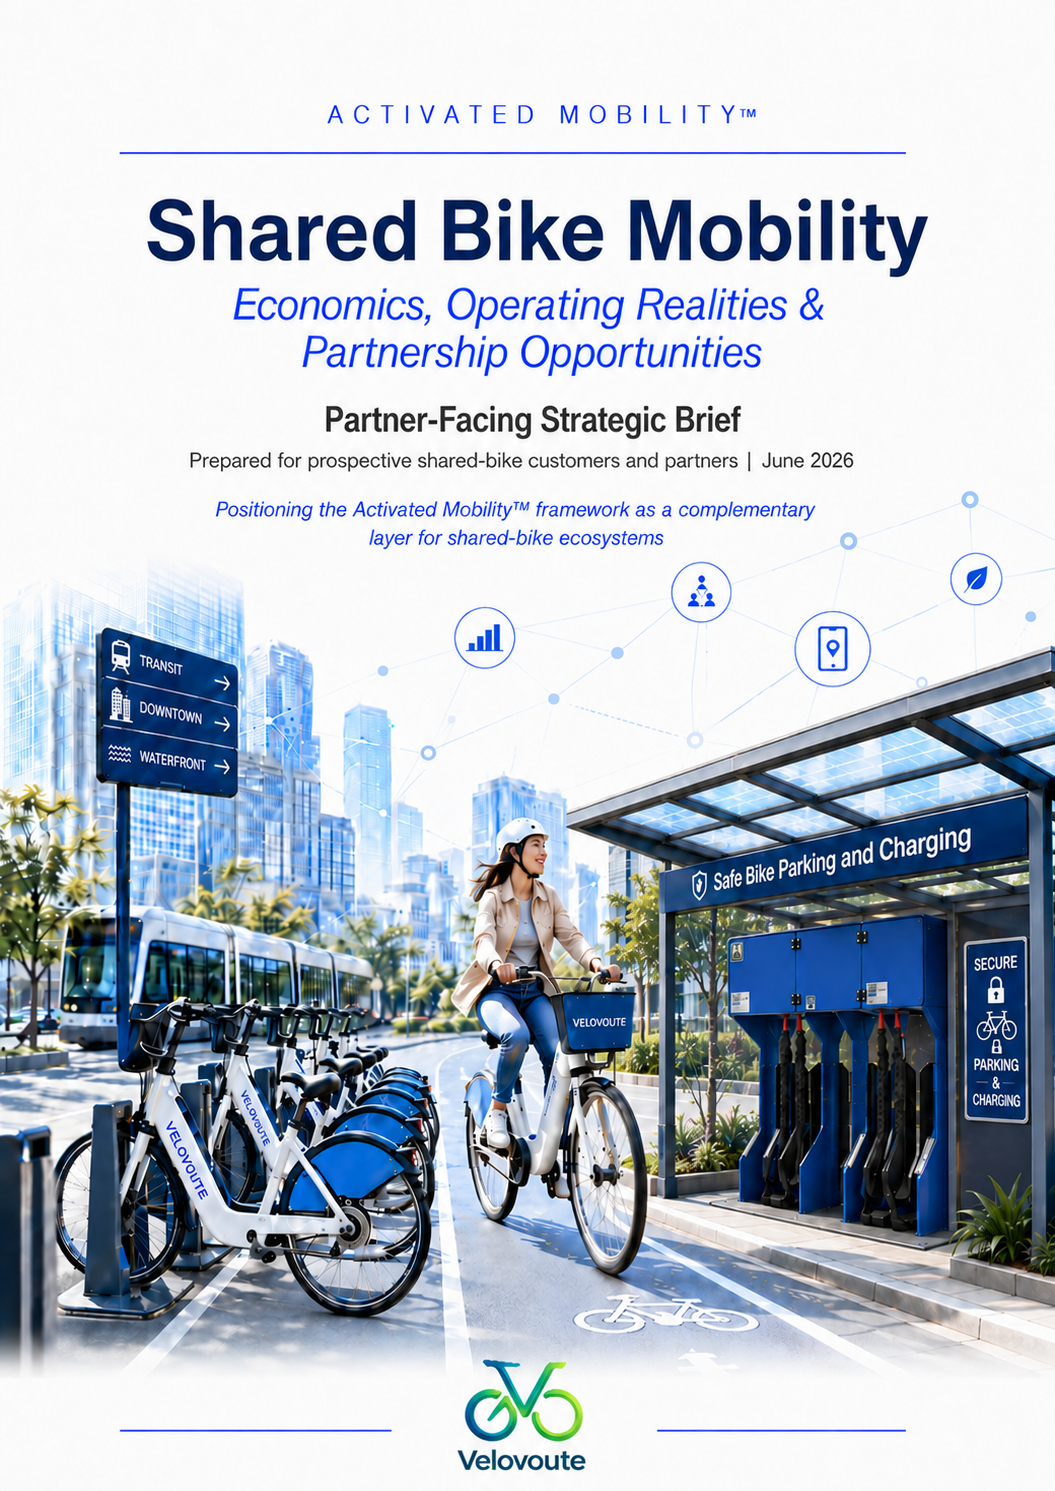
𝗔𝗰𝘁𝗶𝘃𝗲 𝗺𝗼𝗯𝗶𝗹𝗶𝘁𝘆 𝗱𝗼𝗲𝘀 𝗻𝗼𝘁 𝗯𝗲𝗴𝗶𝗻 𝘄𝗶𝘁𝗵 𝗮 𝗯𝗶𝗰𝘆𝗰𝗹𝗲. 𝗜𝘁 𝗯𝗲𝗴𝗶𝗻𝘀 𝘄𝗶𝘁𝗵 𝗰𝗼𝗻𝗳𝗶𝗱𝗲𝗻𝗰𝗲 𝗮𝘁 𝘁𝗵𝗲 𝗱𝗲𝘀𝘁𝗶𝗻𝗮𝘁𝗶𝗼𝗻.
Activated Mobility™ helps people use the bicycles and e-bikes they already own by making secure parking visible, reservable and connected. Through Velovoute and Bike Oasis, users gain confidence at the destination, while municipalities and property owners benefit from a measurable, lower-burden and revenue-generating mobility service.


World Bicycle Day: We Don't Need More Bicycles. We Need More Confidence
World Bicycle Day is not only about celebrating the bicycle. It is about recognizing its potential as a tool for health, sustainability, inclusion, and economic resilience.
With Belgium’s new Be Cyclist 2.0 Action Plan, the conversation now shifts from simply promoting cycling to removing the real barriers that prevent people from riding every day.
The next cycling revolution may not come from adding more bicycles.
It may come from activating the ones people already own.
𝗪𝗛𝗔𝗧 𝗜𝗙 𝗪𝗘 𝗟𝗢𝗢𝗞𝗘𝗗 𝗔𝗧 𝗠𝗢𝗕𝗜𝗟𝗜𝗧𝗬 𝗗𝗜𝗙𝗙𝗘𝗥𝗘𝗡𝗧𝗟𝗬?
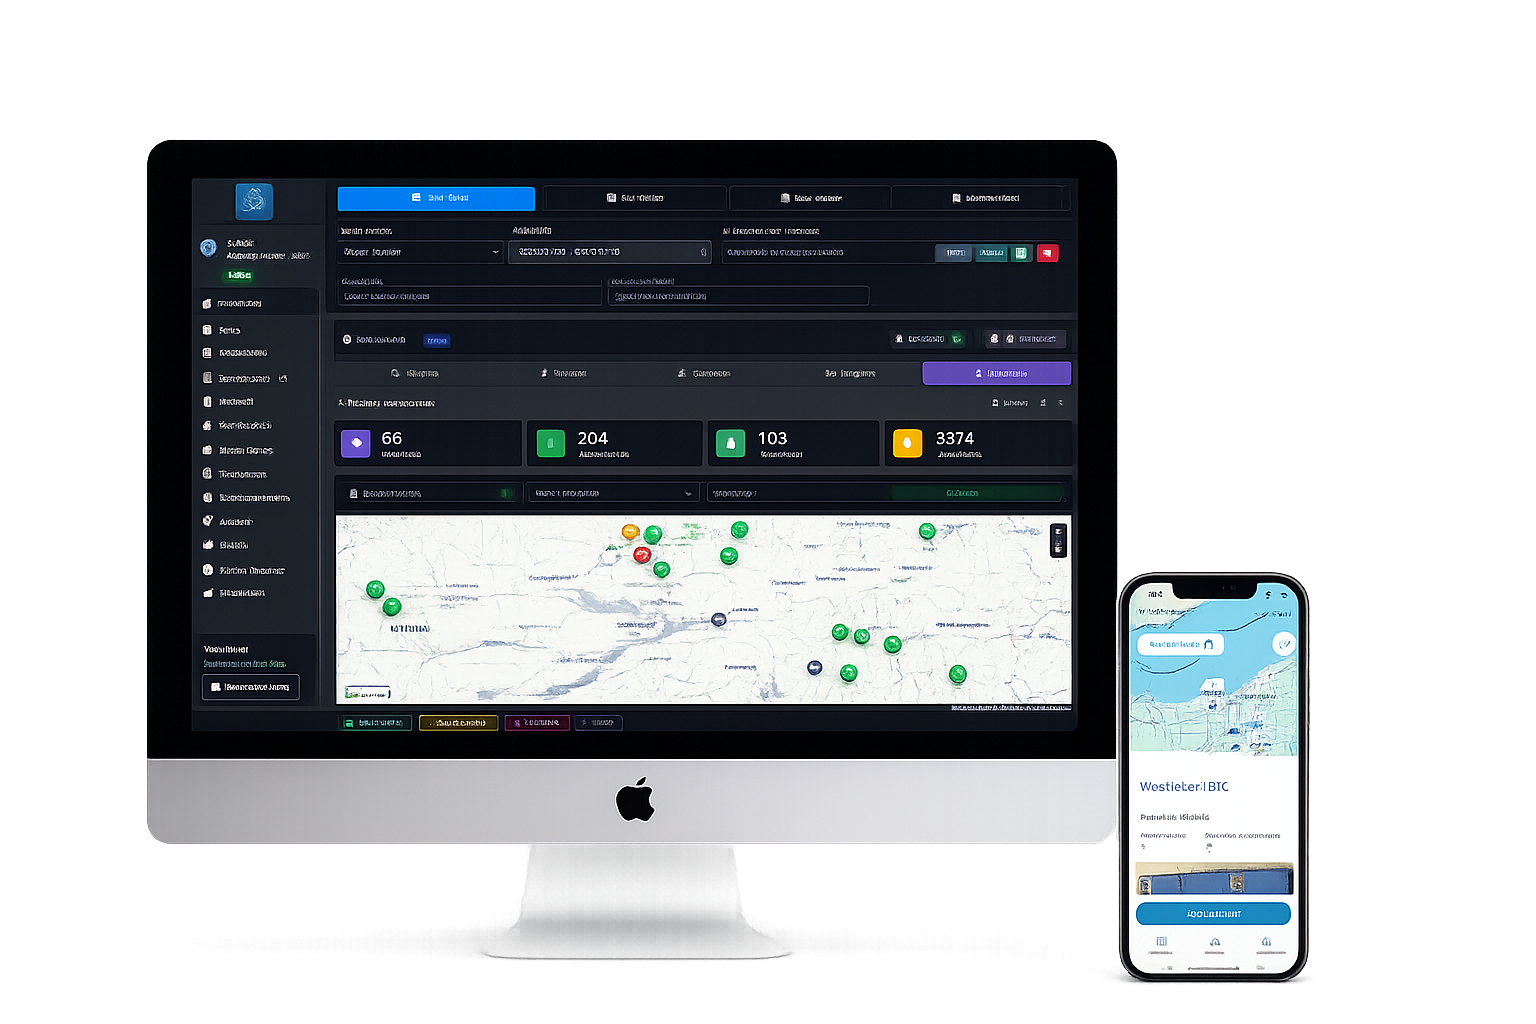
Active mobility is not only about bike lanes or bike share systems. It is also about whether people can arrive with confidence. This article explores the concept of Activated Mobility™ through Velovoute and Bike Oasis — an approach focused on secure arrival, e-bike charging, battery-risk management, and intelligent mobility infrastructure.
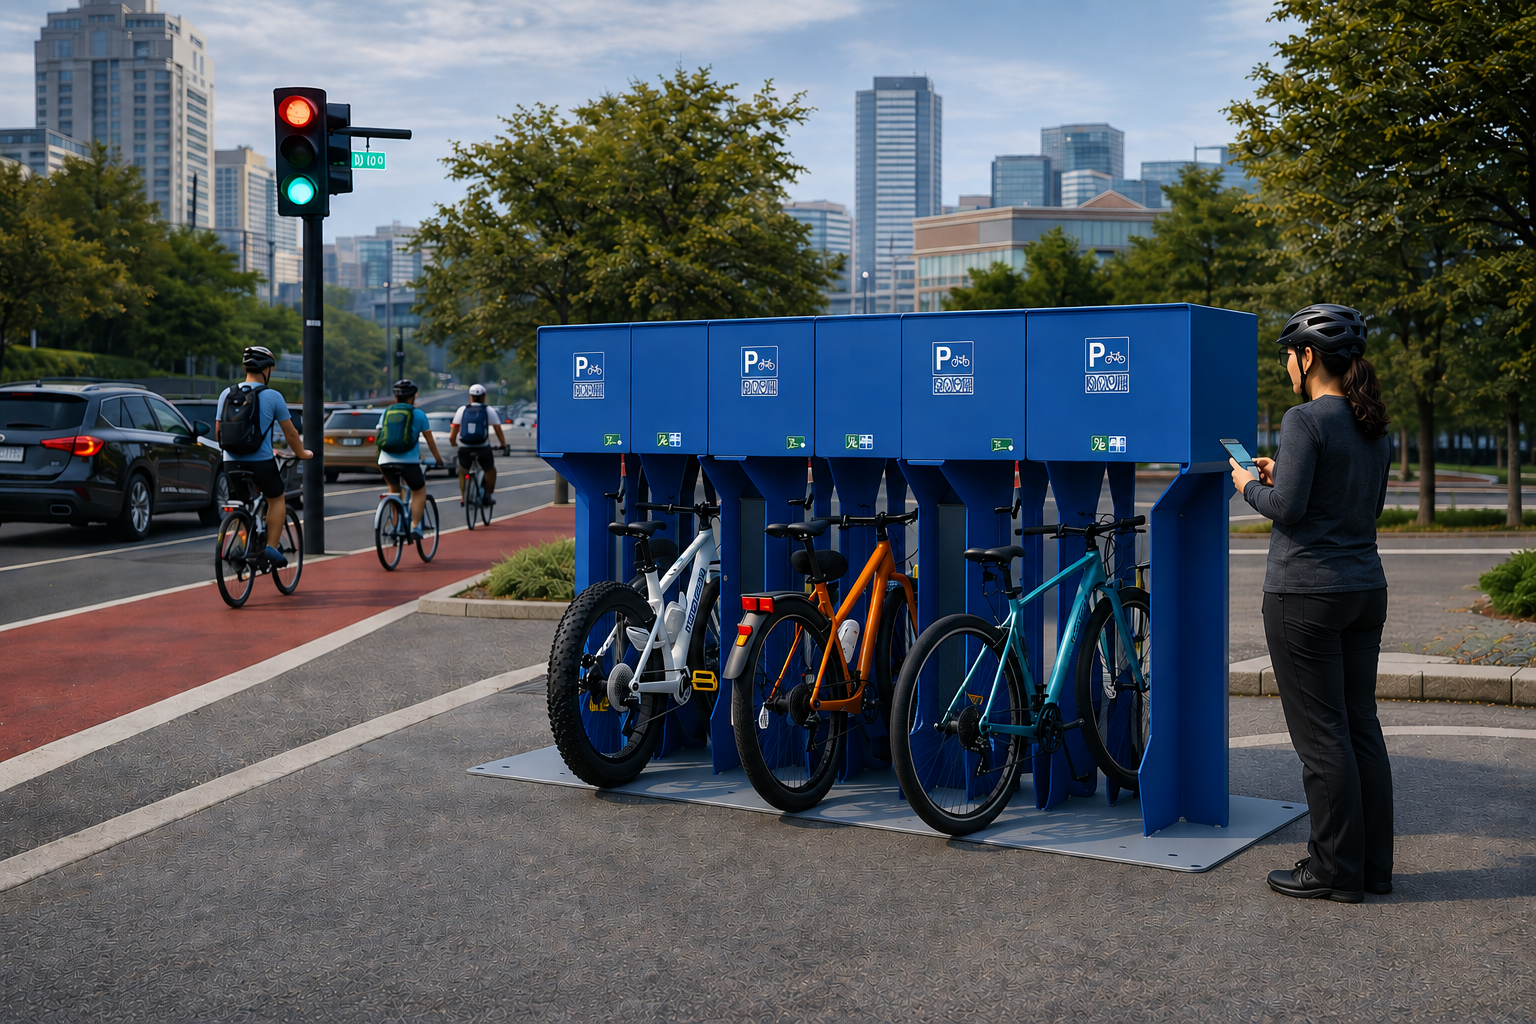
Bike-Positive Infrastructure
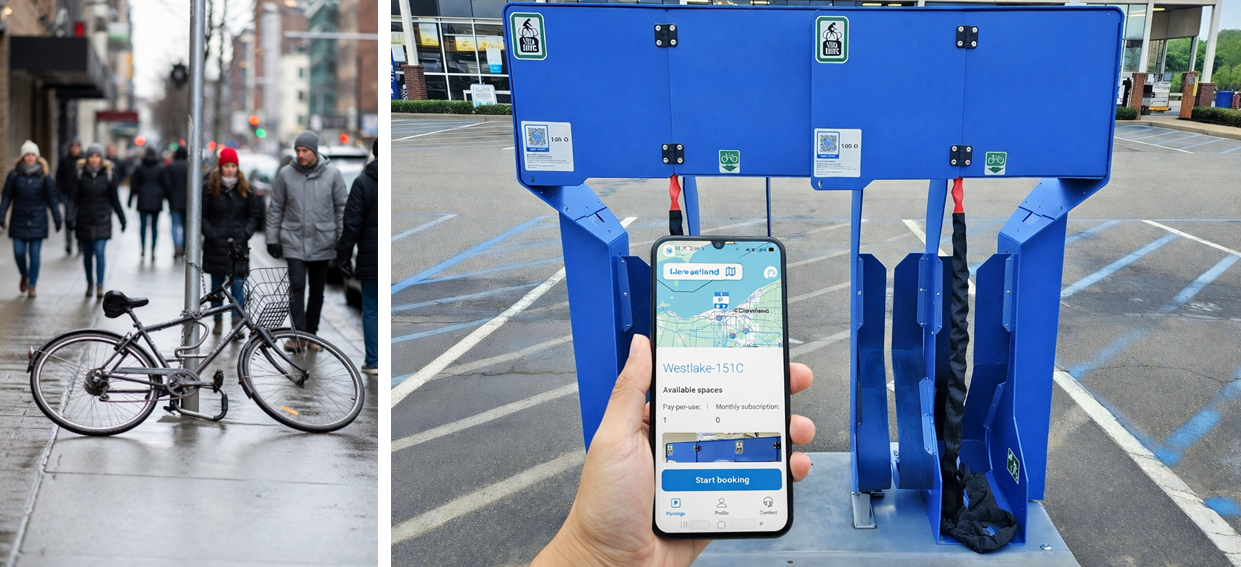
Most people are not anti-bike. Most people are uncertainty-averse.
Can I arrive safely?
Will my bike still be there afterward?
Can I charge my e-bike securely?
Can I rely on this option every day, year-round?
Travel behaviour is not shaped by intention alone. It is shaped by infrastructure.
Bike-positive infrastructure is not just about bike lanes. It is about creating complete mobility ecosystems that make active transportation reliable, predictable, and practical at the point of arrival.