
5. The true impact of secure e-bike parking becomes clear when usage is analyzed over time.
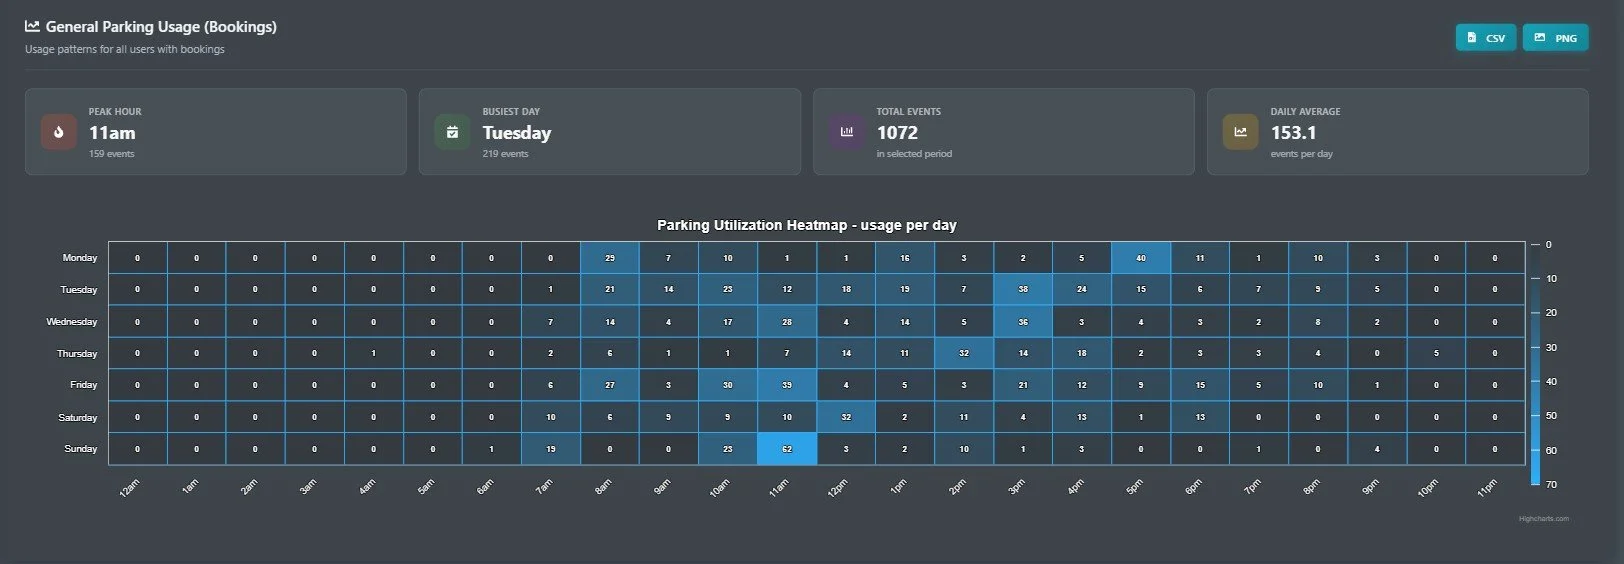
Bike-Oasis usage heat map showing consistent weekday demand, clear peak hours, and weekend surges—evidence of repeatable, habitual bike use.
The Bike-Oasis admin heat map reveals consistent, repeatable patterns of use across days and hours—peaking during late-morning and early-afternoon periods, with sustained activity on weekdays and distinct, higher-intensity bursts on weekends. This temporal concentration confirms that secure e-bike parking is not used sporadically, but as part of regular daily routines.
When this real-world usage data is combined with Don Cicleto’s extensive European deployment experience and early North American patterns, a clear picture emerges: a single secure stall typically enables multiple car trips to be replaced each day, rather than occasional or marginal shifts.
In practice, one secure stall supports:
1–3 displaced car trips per weekday, aligned with commuting, errands, and campus schedules
2–6 displaced car trips on weekends in mixed-use and retail environments, where usage intensifies during mid-day and afternoon peaks
Even higher displacement rates on university campuses, where predictable schedules and limited car parking amplify mode shift
Using a conservative annual model, these observed patterns translate into:
400–900 displaced car trips per stall, per year
When deployed at scale—across 40, 80, or 200 stalls—these impacts compound into a measurable, portfolio-level mobility effect. Crucially, this is not modeled or assumed behavior; it is supported by verified booking, occupancy, and dwell-time data captured directly through the Bike-Oasis platform.
As a result, secure e-bike parking becomes a defensible input for:
GHG Protocol Scope-3 avoided-emissions reporting
TCFD climate-risk and transition disclosures
GRESB real-asset sustainability benchmarking
Unlike aspirational mobility targets or survey-based estimates, secure parking generates verifiable, repeatable outcomes—linking infrastructure investment directly to observed behavior change and measurable ESG performance.